
312-656-9999
A data-driven look at multifamily and commercial real estate opportunities across Chicago’s South Side and South Cook County, with sourced 2026 market data, submarket comparisons, and a practical framework for evaluating a deal.
Is Southern Chicago a Good Place to Invest in Real Estate?
Southern Chicago can offer investors relatively affordable entry pricing, multifamily cap rates and cash-on-cash returns that outperform most major metros, and a rare concentration of large institutional investment. It also carries real risk: aging building stock, property tax volatility, and uneven neighborhood-level data. Outcomes depend heavily on how carefully you underwrite the individual property, not the neighborhood story.
Three things are driving investor interest in 2026:
- Relative affordability with strong cash flow. Kiser Group, a Chicago multifamily brokerage active on the South Side, reports cash-on-cash returns consistently in the 8%-12% range across neighborhoods including Englewood, Bronzeville, Woodlawn, South Shore, Chatham, and Washington Park, compared with 1%-3% or negative returns the firm cites in many coastal markets.
- A rare wave of anchor investment. The $850 million Obama Presidential Center opened in 2026 near Woodlawn and South Shore. The $9 billion Illinois Quantum and Microelectronics Park broke ground on the former U.S. Steel South Works site in South Chicago. Advocate Health is investing $1 billion in the South Side, including a new $300 million hospital on that same South Works site. That’s roughly $10 billion in combined investment converging on one South Side corridor.
- Constrained new multifamily supply. CBRE projects 2026 will be Chicago’s lowest year for multifamily completions since the Great Financial Crisis, which supports pricing power for owners of existing buildings.
Chicago Multifamily Market: The 2026 Numbers
Chicago multifamily fundamentals are outperforming the national average on nearly every metric research firms track in 2026.
- Occupancy: 96.0% on a stabilized-asset basis as of March 2026, versus a 94.2% national average (Yardi Matrix).
- Rent growth: CBRE reported 4.6% year-over-year growth as of Q3 2025 with a 2026 forecast of roughly 3% more. Yardi Matrix separately reported 3.3% year-over-year growth through April 2026, ranking Chicago behind only New York City and San Francisco among the top 30 U.S. markets. These are two different firms measuring different periods, so treat them as directional, not identical.
- Construction: Only 710 new units delivered metro-wide from January through April 2026, with roughly 11,200 units under construction, a pipeline CBRE calls the smallest relative to demand of any major U.S. metro.
- Transaction volume: $1.8 billion in multifamily sales January through April 2026, up from $1.1 billion in the same period of 2025.
Investor insight: When new supply stays this thin, existing buildings absorb the demand. That’s exactly why occupancy and renewal rates (Marcus & Millichap cites renewal conversion above 60% in early 2026) have stayed strong even as financing costs remain elevated.
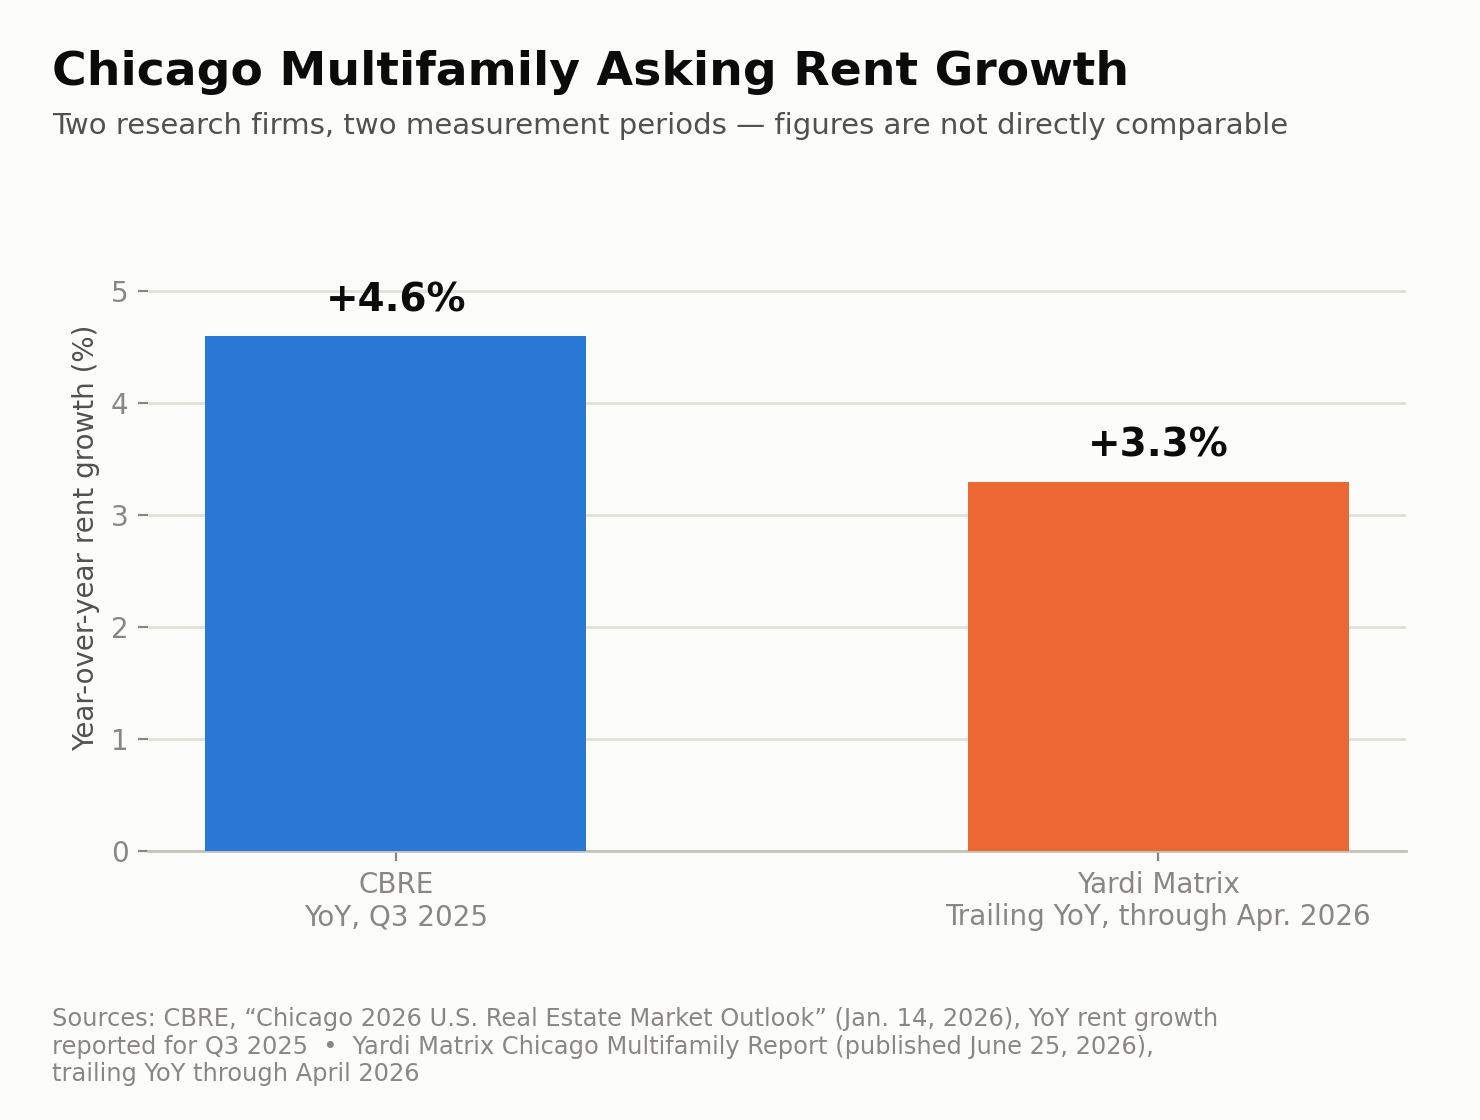
Rent growth by source and reporting period. Source: CBRE (Jan. 14, 2026); Yardi Matrix Chicago Multifamily Report (June 25, 2026).
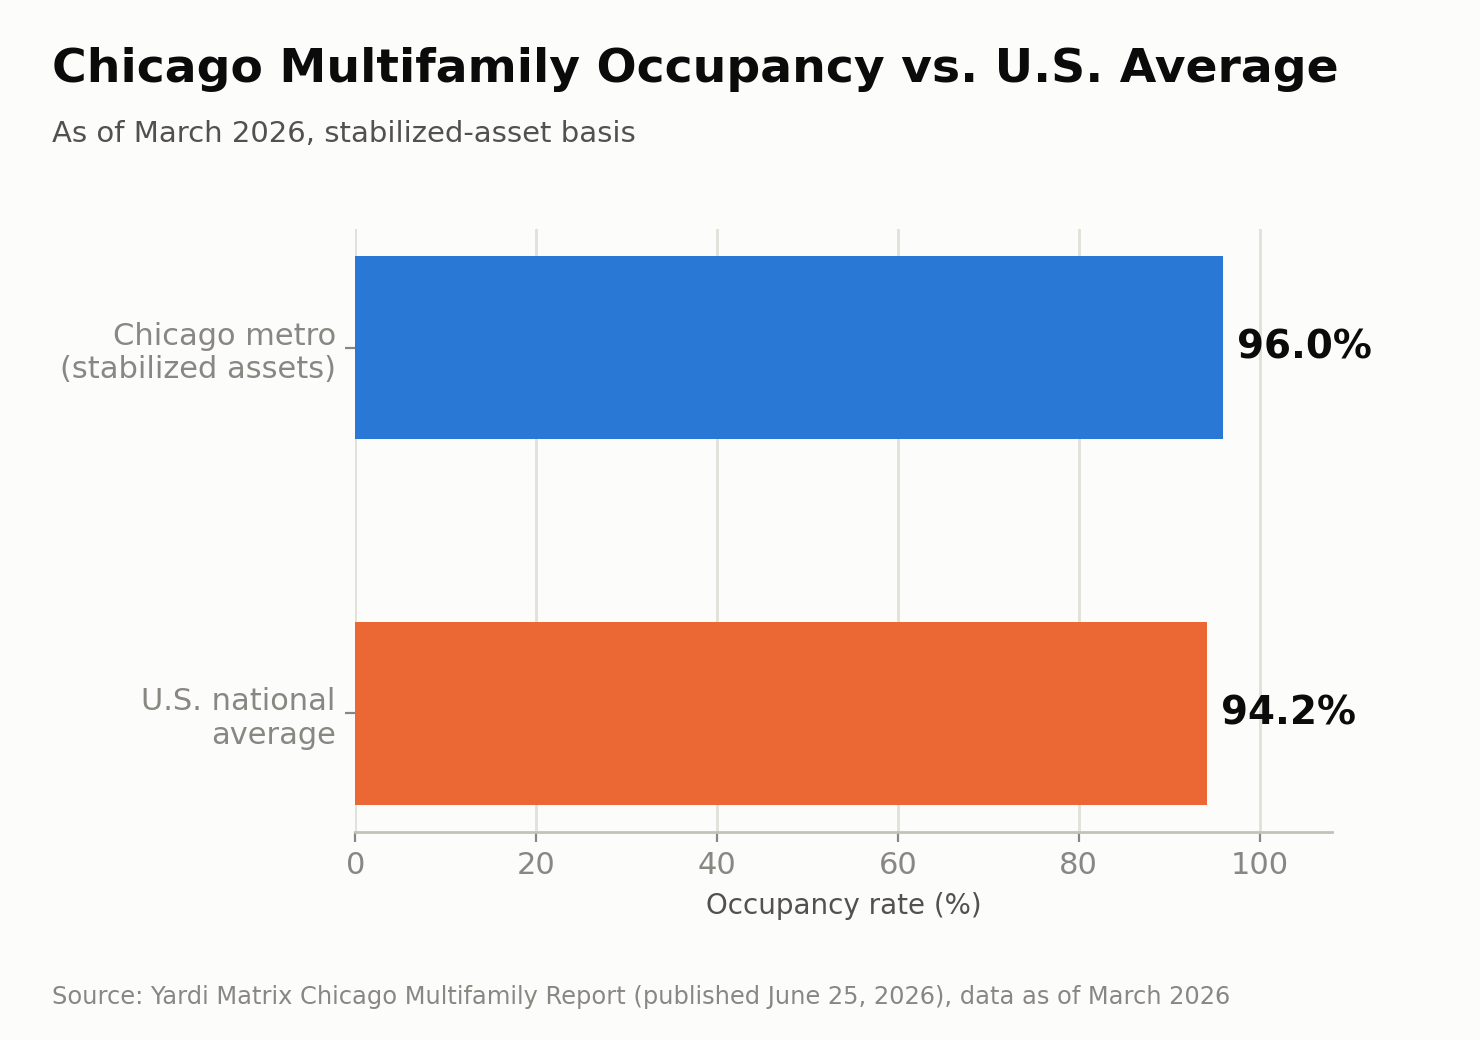
Chicago occupancy vs. the U.S. national average. Source: Yardi Matrix Chicago Multifamily Report (June 25, 2026), data as of March 2026.
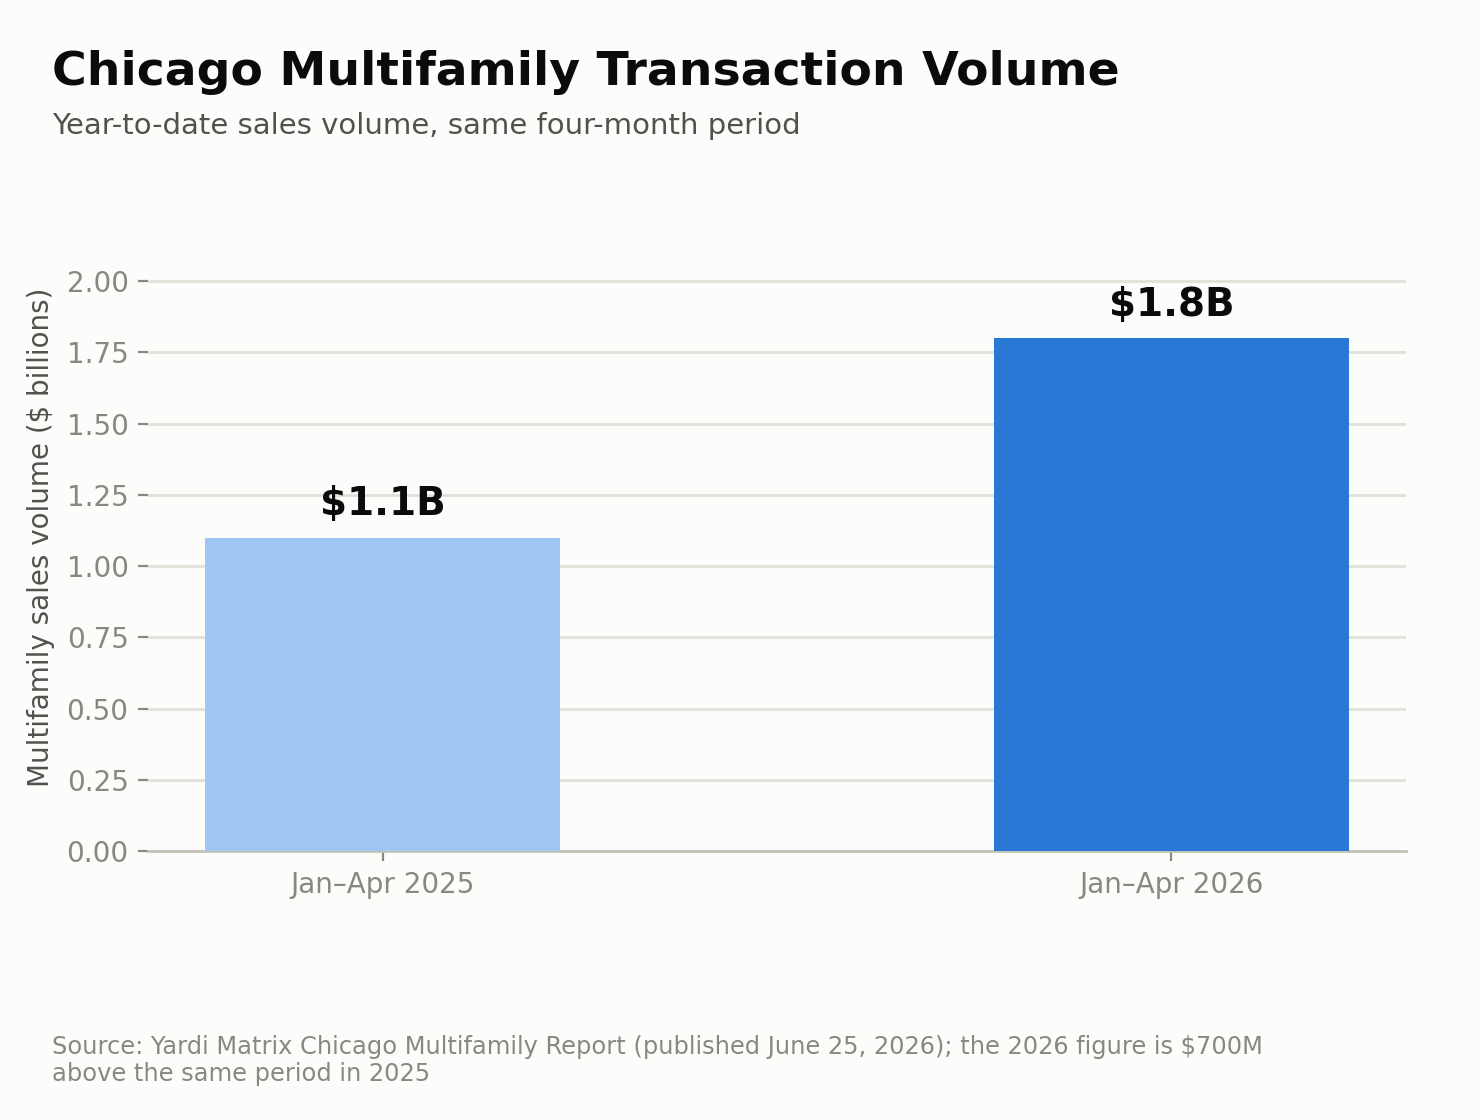
Year-to-date multifamily sales volume. Source: Yardi Matrix Chicago Multifamily Report (June 25, 2026).
The Value-Add Opportunity in South Side Multifamily
Most of the South Side’s multifamily stock is Class B and C: courtyard buildings and small apartment blocks built between the 1900s and 1960s, much of it never substantially renovated. That’s the opportunity, a documented gap between in-place and renovated market rents.
Reporting tied to the Obama Presidential Center’s opening found one-bedroom rents near the Center rose from roughly $1,200 to $1,800 as units were renovated and repositioned. South Shore per-unit multifamily pricing rose from under $60,000 in 2019 to about $73,000 in 2024 (DePaul Institute for Housing Studies data), appreciation, but still a fraction of per-unit pricing on Chicago’s North Side or in most coastal secondary markets.
Budget for three things renovation underwriting often misses:
- Cook County property tax reassessment. A renovated, higher-value building can see a meaningfully higher tax bill within one to two reassessment cycles.
- Insurance costs, which have risen broadly across the Midwest, especially for older masonry buildings.
- Building systems: plumbing, electrical, and roofing in pre-1960s buildings often need capital work beyond cosmetic renovation.
A Warning Sign Worth Knowing: South Shore Foreclosure Activity
Not every recent South Side acquisition has gone well. South Shore saw 20 foreclosure lawsuits filed against 5+ unit buildings in 2024, the highest annual total in a decade, and roughly a quarter of delinquent Chicago multifamily CMBS loans traced back to South Shore properties specifically. That’s not a reason to avoid the neighborhood. It’s evidence that a wave of out-of-state buyers acquired properties too aggressively for the actual rent-collection environment. Underwrite off verified trailing rent rolls and real collections history, not pro forma projections.
Southern Chicago Commercial Real Estate
Commercial performance varies sharply by property type on the South Side.
Neighborhood retail is showing real, if selective, momentum: a Whole Foods opened in Englewood, a Mariano’s in Bronzeville, and a Jewel-Osco in Woodlawn, alongside Starbucks and Chipotle locations. In Pullman, a Starbucks and a Slim & Husky’s are both slated to open by 2027 as part of the neighborhood’s broader Historic District redevelopment.
Office isn’t a meaningful South Side asset class. Citywide office data describes downtown and North Side product and doesn’t apply here.
Industrial is the strongest and most data-rich commercial category touching the South Side, covered in detail below.
Industrial and Warehouse: South Cook County’s Advantage
Chicago industrial vacancy sits between 4.5% and 4.8% depending on the research firm (WareCRE, Cushman & Wakefield, and JLL all tracked Q1-Q2 2026 slightly differently), tight by any major-metro standard, even after ticking up modestly from 2025.
South Cook County sits inside two of the metro’s most active corridors:
- I-80/Joliet Corridor: Roughly 12.3% vacancy, asking rents of $4.75-$6.50/SF NNN, and the metro’s leading leasing activity in 2026 (5.1 million SF through mid-year), plus 52% of the region’s total industrial construction pipeline. Recent large leases include KeHe Distributors (1.2 million SF) and Hyundai Translead (906,500 SF), both in Joliet.
- South Suburbs: Asking rents of $5.00-$7.00/SF NNN, described by WareCRE as a value-oriented, cost-sensitive segment of the market.
- I-55 Corridor: Asking rents of $5.50-$8.00/SF NNN.
- For comparison, the tightest submarket, O’Hare infill/last-mile, runs $12-$22/SF NNN with about 2.9% vacancy.
Investor insight: That pricing gap is the opportunity. South Cook County lets owner-users and small-bay investors buy in well below the metro’s tightest submarkets without needing O’Hare-level tenant demand to make the numbers work.

Submarket rent comparison including the South Suburbs. Source: WareCRE Chicago Industrial & Warehouse Market Report, Q1 2026.
Neighborhood-Level Snapshot
Neighborhood data on the South Side is genuinely uneven: different sources, different time periods, different metrics. Here’s what’s verifiable, with sources:
- South Lawndale/Brighton Park: +11.0% year-over-year home price index change, the largest gain in Cook County (DePaul Institute for Housing Studies, Q4 2025).
- Englewood/Greater Grand Crossing: +114.3% price recovery from its COVID-era low, the largest recovery in the county, though off a historically depressed base (DePaul IHS).
- Bronzeville/Hyde Park: +218.4% long-run price growth since 2000, one of the county’s most consistent appreciation trends (DePaul IHS).
- South Chicago/Hegewisch: +77.1% recovery from its COVID-era low (DePaul IHS).
- Bridgeport: $589,000 average single-family sale price, +13.3% year-over-year, the only South Side neighborhood with current (July 2026) pricing in InfoSparks MLS data.
- East Woodlawn (60637): Median home prices roughly doubled from 2019 to 2025, to about $440,000, per DePaul IHS data cited in The Real Deal.
The two fastest-recovering submarkets by percentage, Englewood/Greater Grand Crossing and South Chicago/Hegewisch, are recovering from historically low price bases, so large percentage gains there reflect both real investment activity and a low starting point. Bridgeport, by contrast, already trades well above the South Side’s broader average.
How to Evaluate a Southern Chicago Investment Property
Market data tells you where to look. It doesn’t tell you what to pay. Run every property through this sequence before making an offer:
- Location: confirm the specific submarket and proximity to transit, jobs, and any anchor projects.
- Purchase price: benchmark against verified closed comparables from county records, not asking prices.
- Price per unit: compare against submarket data (e.g., South Shore’s ~$73,000/unit 2024 reference point).
- In-place rents: pull from signed leases and actual collections, not the seller’s rent-roll summary.
- Market rent: validate against genuinely comparable renovated units in the same submarket.
- Vacancy and collections history: request trailing 12-24 months of actual collections. High scheduled rent with low collections is a red flag in this market.
- Gross potential income: full rent roll at market rent and full occupancy.
- Effective gross income: gross potential income adjusted for realistic vacancy and collection loss.
- Operating expenses: management, maintenance, utilities, reserves, as a real line-item budget.
- NOI: effective gross income minus operating expenses.
- Cap rate: NOI divided by purchase price, benchmarked against comparable South Side transactions.
- Financing terms: actual quoted rate and terms from a lender active in this submarket and deal size.
- Debt service coverage ratio: most lenders want 1.20-1.25x or higher. Treat a low DSCR as a real constraint.
- Cash-on-cash return: this is the number most comparable to Kiser Group’s 8%-12% South Side range, and it should come from your deal’s actual terms.
- Renovation costs: contractor-verified, with contingency, before you finalize an offer.
- Property taxes: model the post-reassessment scenario, not just the current bill.
- Insurance: get an actual quote for the specific property.
- Property management: decide self-manage vs. third-party before closing.
- Exit strategy: define your hold period and a realistic, not optimistic, exit cap rate.
Risks to Understand Before You Buy
- Property taxes. Cook County reassessments can meaningfully raise the tax bill after a renovation or a documented rise in comparable sale prices.
- Insurance. Get a real quote before you underwrite, especially for older masonry buildings.
- Financing. The 30-year fixed rate sits at 6.67% as of mid-August 2026 (Freddie Mac), and smaller deals often face a narrower lender pool.
- Deferred maintenance. Much of the South Side’s stock predates 1960. Budget for roofing, plumbing, and electrical beyond cosmetic work.
- Overpaying on a narrative. The most avoidable risk in this market. Price off verified income and comparables, not proximity to an anchor project.
- Policy risk near the Obama Presidential Center. The City implemented a Jackson Park-area housing pilot program in April 2026, and community groups near the IQMP site are pushing for property tax relief and affordability guarantees. Watch local ordinance activity if you’re investing in Woodlawn or South Shore specifically.
2026 Outlook
Mortgage rates look likely to hold roughly steady near current levels. Freddie Mac’s 30-year fixed rate has moved narrowly all year. Both multifamily and industrial construction pipelines point toward continued tightness through 2026 and into 2027, which should keep favoring owners of existing product. The clearest thing to watch: whether Cook County’s next reassessment cycle produces significant tax increases in the fastest-appreciating submarkets identified above, and whether the Illinois Quantum Park and Advocate Health construction programs stay on their announced timelines.
Frequently Asked Questions
Is Southern Chicago a good place to invest in real estate?
It can be. Southern Chicago offers relatively affordable pricing, multifamily returns reported in the 8%-12% range, and unusual anchor investment, but aging building stock and uneven neighborhood data mean outcomes depend on careful, property-level underwriting.
What are the best South Side neighborhoods for multifamily investment?
Woodlawn, South Shore, Bronzeville, and Hyde Park show the clearest documented momentum. South Chicago is a longer-horizon thesis tied to the Illinois Quantum Park and Advocate Health investments, which haven’t yet shown the same price movement.
Is Chicago multifamily still a good investment in 2026?
Fundamentals support it: 96% stabilized occupancy, rent growth outperforming the national average, and the metro’s lowest construction pipeline since the Great Financial Crisis. Returns still depend on financing terms and execution at the property level.
What is the current Chicago multifamily vacancy rate?
Yardi Matrix reported 96.0% stabilized occupancy as of March 2026 (roughly 4% vacancy on that basis), versus 94.2% nationally.
Are Chicago apartment rents increasing?
Yes. CBRE reported 4.6% year-over-year growth as of Q3 2025; Yardi Matrix reported 3.3% through April 2026. Both outperformed the national average over their respective periods.
What is a good cap rate for a Chicago multifamily property?
There’s no single sourced market-wide cap rate specific to Southern Chicago. Kiser Group reports cash-on-cash returns of 8%-12% across several South Side neighborhoods. Benchmark any specific cap rate assumption against verified, closed comparables for your submarket and asset class.
What commercial properties are performing well in Southern Chicago?
Industrial and warehouse assets in the I-80 and I-55 corridors show the strongest fundamentals. Neighborhood retail is picking up in specific corridors tied to grocery and quick-service anchor openings.
What are the biggest risks of investing in Southern Chicago?
Property tax reassessment, insurance cost increases, financing availability for smaller deals, deferred maintenance, thin neighborhood-level data, and, particularly in South Shore, a documented recent history of foreclosure activity following aggressive acquisitions.
What should I analyze before buying a multifamily property in Chicago?
At minimum: verified trailing rent roll and collections, comparable closed sales, a realistic post-renovation tax scenario, an actual insurance quote, and a debt service coverage ratio from real financing terms. See the full evaluation framework above.
Is Southern Chicago good for value-add multifamily investing?
The data supports it in small-to-midsize Class B/C buildings where a documented gap exists between in-place and renovated rents, like the $1,200-to-$1,800 one-bedroom range reported near the Obama Presidential Center. Execution risk is the main variable.
Sources
- CBRE, “Chicago 2026 U.S. Real Estate Market Outlook” (Jan. 14, 2026)
- Yardi Matrix, Chicago Multifamily Market Report (published June 25, 2026)
- Marcus & Millichap, Chicago Multifamily Market Report, 2Q 2026
- WareCRE, Chicago Industrial & Warehouse Market Report, Q1 2026
- Cushman & Wakefield, MarketBeat Chicago Industrial, Q2 2026
- JLL, Chicago Industrial Market Dynamics, Q2 2026
- DePaul University Institute for Housing Studies, Cook County House Price Index, Q4 2025
- Kiser Group, South Side apartment investment market commentary
- The Real Deal and WBEZ Chicago, reporting on the Obama Presidential Center’s real estate impact (June 2026)
- The TRiiBE, reporting on the Illinois Quantum and Microelectronics Park (March 2026)
- Advocate Health, South Side hospital groundbreaking announcement (June 2026)
- Illinois Department of Employment Security; Freddie Mac Primary Mortgage Market Survey
This article is for informational purposes only and is not investment, legal, or tax advice. Market data reflects conditions reported as of August 2026 and may change. Verify all figures against current, property-specific due diligence before making an investment decision.